


The volatility of crypto prices has led to the fragility of the DeFi market and massive automatic liquidations in future positions. TRB price predictions can vary, but here’s the main thing: further developments could push the value of Tellor TRB higher.
Overview
| Cryptocurrency | Tellor |
| Ticker | TRB |
| Market cap | $84,829,048.27 |
| Trading volume | $31,763,592.76 |
| Circulating supply | 2.74M TRB |
| All-time high | $ 602.98 on Jan 01, 2024 |
| All-time low | $1.11 on Nov 19, 2019 |
| 24-hour high | $30.13 |
| 24-hour low | $32.37 |
Tellor price prediction: Technical analysis
| Fear and Greed Index | Value |
| Volatility (30-day variation) | 10.44% |
| 50-day SMA | $ 27.20 |
| 200-day SMA | $ 50.45 |
| Sentiment | Neutral |
| Fear and greed index | 65(Greed) |
| Green days | 18/30 (60%) |
Tellor price analysis
TL; DR Breakdown:
- TRB holds strong above the $30 support, aiming for the next resistance near the $38 level.
- RSI is 63, and bullish MACD crossover confirms Tellor’s strengthening price movement.
- Price action shows higher lows and bullish structure, indicating further upside potential for TRB.
As of the time of writing(April 28, 2025), TRB had gained significantly to trade around $30.82. The price movement shows a sustained bullish breakout, with prices climbing from a recent low near $19.50.Market experts indicate the rally was fueled by consistent buying pressure, as seen from the higher trading volumes accompanying the movement.
TRB/USD 1-day chart
The TRB/USD 1-day chart shows a strong recovery after bouncing from the $20 support zone. Price action is trending higher, with TRB now holding above $30.88. The RSI at 63.27 suggests bullish momentum, while the MACD crossover confirms strengthening upside pressure. Traders are watching if TRB can extend toward the next resistance near $38.

TRB 4-hour price analysis: TRB eyes recovery as bullish momentum builds
On the 4-hour chart, TRB shows signs of a short-term bullish reversal after bouncing from the $22.79 support level. It is currently trading around $30.95. The RSI has climbed above 50, indicating a strengthening movement without being overbought.
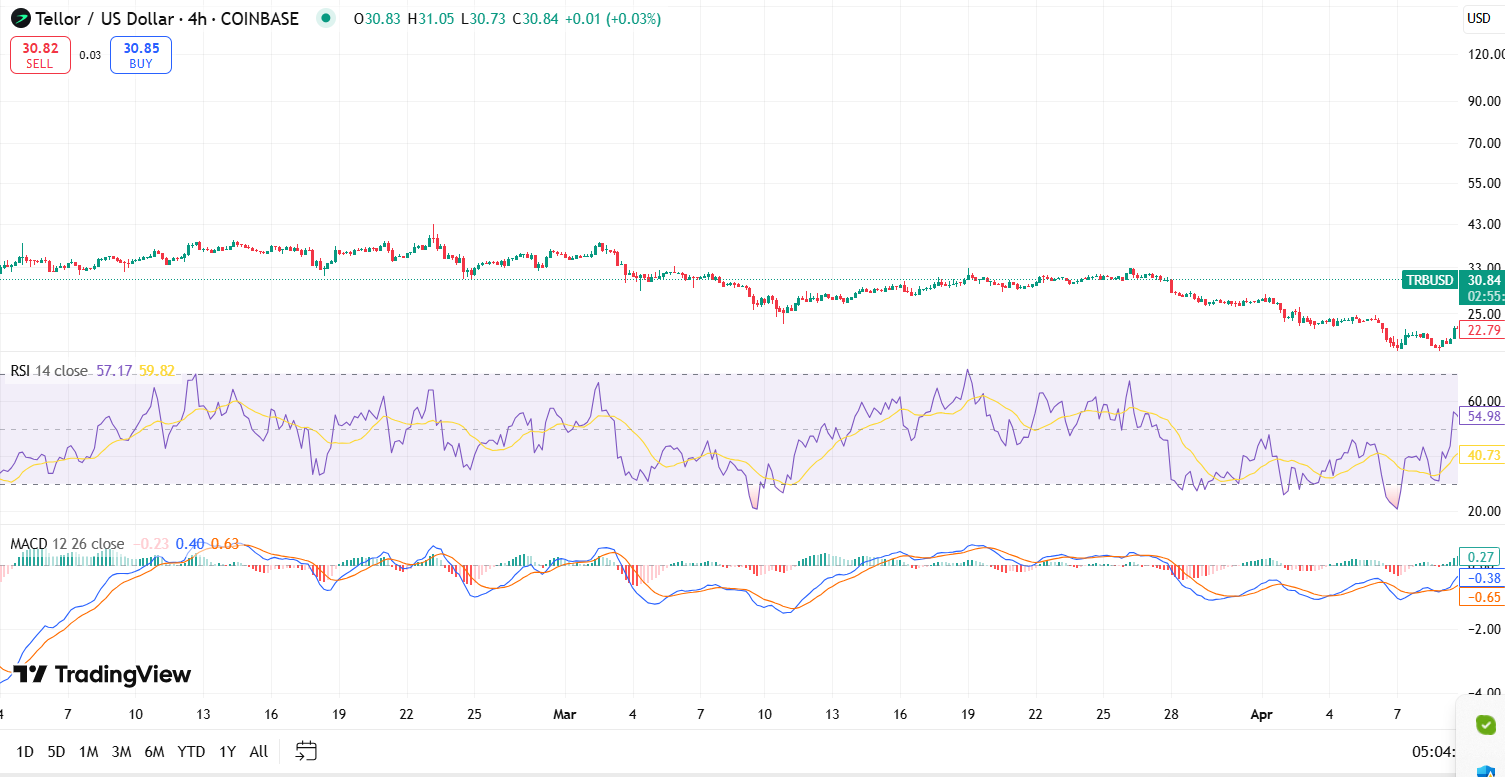
The MACD bullish crossover further supports the potential for continued upward movement. Immediate resistance lies around $32–$35, while support remains near $25.
Tellor technical analysis: Levels and action
Daily simple moving average (SMA)
| Period | Value | Action |
|---|---|---|
| SMA 3 | $28.39 | BUY |
| SMA 5 | $29.54 | BUY |
| SMA 10 | $28.72 | BUY |
| SMA 21 | $26.01 | BUY |
| SMA 50 | $27.27 | BUY |
| SMA 100 | $33.73 | SELL |
| SMA 200 | $49.98 | SELL |
Daily exponential moving average (EMA)
| Period | Value | Action |
|---|---|---|
| EMA 3 | $25.33 | BUY |
| EMA 5 | $24.58 | BUY |
| EMA 10 | $24.76 | BUY |
| EMA 21 | $26.27 | BUY |
| EMA 50 | $30.52 | SELL |
| EMA 100 | $38.32 | SELL |
| EMA 200 | $49.45 | SELL |
What to expect from TRB price analysis next
TRB (Tellor Tributes) is currently trading at around $30.88, with analysts forecasting potential growth to $33-$34 by early May 2025; long-term projections vary widely. As always with cryptocurrencies, TRB’s price remains volatile, influenced by market sentiment and broader economic factors.
Is TRB a good investment?
If TRB holds above $30.00 and volume strengthens, it may offer a short-term trading opportunity rather than a long-term investment at this stage. Explore Cryptopolitan’s price prediction to learn about the coin’s trajectory from 2025 to 2031.
Why is TRB down?
TRB is trading at its lowest this year; the crypto market capitalization has also dropped significantly. The drop in TRB value could be attributed to the general market sentiment.

Will TRB recover?
The Tellor platform continues registering new partnerships, raising hopes for token holders. This factor suggests a recovery when market sentiment changes.
Will TRB reach $50?
TRB will cross the $50 mark in 2029.
Will TRB reach $100?
TRB will approach the $100 mark by 2031.
Will TRB reach $500?
Per expert analysis, TRB might soon cross the $500 mark, having previously reached an all-time high of $602.98.
Does Tellor have a good long-term future?
According to Cryptopolitan price predictions, TRB will trade higher in the years to come. However, factors like market crashes or difficult regulations could invalidate this bullish theory.
TRB price prediction April 2025
For April 2025, TRB will trade between $30.07 and $34.87, with an average price of $32.02.
| Month | Potential low ($) | Potential average ($) | Potential high ($) |
| April | 30.07 | 32.02 | 34.87 |
TRB price predictions 2025
As 2025 unfolds, TRB might trade between $20.07 and $41.87, with an average price of $29.52.
| Year | Potential low ($) | Potential average ($) | Potential high ($) |
| 2025 | 20.07 | 29.52 | 41.87 |
Tellor price predictions 2026-2031
| Year | Potential low ($) | Potential average ($) | Potential high ($) |
| 2026 | 33.96 | 36.26 | 44.09 |
| 2027 | 39.02 | 42.15 | 46.94 |
| 2028 | 43.65 | 46.32 | 49.21 |
| 2029 | 50.78 | 54.12 | 58.36 |
| 2030 | 52.53 | 56.21 | 60.17 |
| 2031 | 60.43 | 66.43 | 72.73 |
Tellor price prediction 2026
The Tellor price prediction for 2026 is a high of $44.09. It will reach a minimum price of $33.96 and an average price of $36.26.